Table of Contents
Introduction
In a previous blog post, Wealth Creation in Rural Communities, I noted that an important element of wealth creation is to understand the economic indicators in your region so that you can begin to plan improvements to them.
Most economic indicators collected by US federal agencies are available at the County level, but some are available only in larger sizes (State-wide) or Census-designated Places (CDP) that may or may not correspond to actual communities as people who live there see them.
Nonetheless, this is a useful exercise. Below you’ll see the data collected. This post collects many of the metrics recommended by Pender, Marré, and Reeder (2012) in their research report on wealth-building in rural communities.
Built Capital
This is the community’s infrastructure including roads, internet and telecommunications, water and sewer systems and others.
Access to Water and Sewer Facilities
According to the American Community Survey’s most recent estimate in 2017 (2007a), the number of people in Sigourney lacking complete plumbing facilities is 30, out of a total of 1004 households or 2.98%. In wider Keokuk County (2007b), this is 196 out of 4892 or 4.00%.
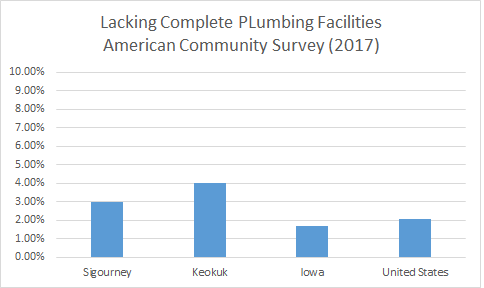
In Iowa the number is 22,938 out of 1,376,133 (1.67%) and in the United States a whole, 2,761,997 out of 135,393,564 (2.04%).
Access to Computers and the Internet
78.4% of the population has access to a computer, while 69.1% of the population has access to broadband internet. (U.S. Census Bureau, 2018) This is significant because access to the internet is a near-necessity for businesses operating in 2019 and investment in this area can improve the economic climate.
Cultural Capital
The mixing of individuals from different cultures and the expression of their cultures through festivals or other events.
Foreign Born
0.9% of the Keokuk County population is born outside of the US, compared to 5% in the state and 13.4% in the entire United States.
Arts and Recreation Employment
Iowa Workforce Development provides a breakdown of employment by occupation. One useful measure of cultural capital is the number of establishments and the amount of employment in the Arts, Recreation and Entertainment industries.
According to data from July 2018 to July 2019 there was approximately 214,000 jobs available in this industry across the State. (Iowa Workforce Development, 2019) Unfortunately County-specific data is not available for this measure.
Financial Capital
The money that individuals and organizations have themselves and have available for investment in new businesses.
Median Household Income for Keokuk County is $48,399 in 2017 dollars. (U.S. Census Bureau, 2018)
Retail Sales per capita in 2012 were $5,305. (U.S. Census Bureau, 2018) An Iowa State University Retail Trade Analysis Report (2018) had indicated by 2018 sales had dropped to $4,228. While the data sources may be different, that is significant.
Human Capital
The knowledge, skills and ability of the individuals in the town.
Population
The population of Keokuk is currently 10,225. 22.9% of the population is under 18 while 21.4% is over 65. This means that 55.7% of the population are between 18 and 64 years old. (U.S. Census Bureau, 2018)
Employment
63.7% of the population 16 and older are working (U.S. Census Bureau, 2018) According to a 2016 Laborshed Analysis by Iowa Workforce Development, 75.1% of the people in the laborshed are employed. This is the area that Sigourney employers may reach out to for employees, and is much larger than the county (containing 52,000+ people.)
Occupation
A previous article of mine included the Location Quotient (LQ) data for Keokuk County. That data is reproduced here:
 Employees in Natural Resources and Mining are nearly 6 times more populous in Keokuk County than Iowa as a whole, while there is less than a third (0.29) workers in State Government located in Keokuk compared to the State as a whole.
Disability
In 2010, 16.6% of the US population aged 21 to 64 had a disability while 11.4% had a severe disability. (U.S. Census Bureau, 2012, p.4) This compares to Keokuk at 9.1% of the population under 65 with a disability. Note that the Keokuk data also includes individuals 0-21.
Mortality Rate
The mortality rate in Keokuk County per 100,000 in 2016 was 12.0. This compares to the State as a whole at 9.4. (Iowa Department of Public Health, 2016, p.128)
School and Student Quality
Educational Attainment
The Adult Community Survey (ACS) included in the Census (U.S. Census Bureau, 2017c) includes a distribution of the population by their educational attainment.

In Keokuk County, for those 18-24 years old:
- 12.7% had less than high school graduation
- 26.9% had high school or equivalent
- 54.7% had some college or an Associates degree
- 5.6% of the population had a Bachelor’s degree or higher
This compares to Iowa as a whole, for those 18-24 years old:
- 10.4% had less than high school graduation
- 26.6% had high school or equivalent
- 52.3% had some college or an Associates degree
- 10.7% of the population had a Bachelor’s degree or higher
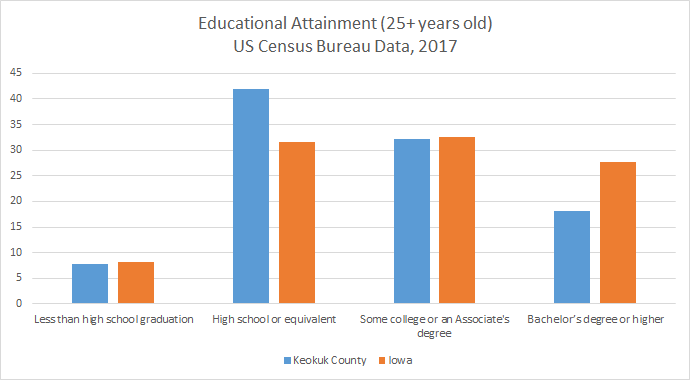
In Keokuk County, for those over 25 years old:
- 7.7% had less than high school graduation
- 41.9% had high school or equivalent
- 32.2% had some college or an Associates degree
- 18.1% had a Bachelor’s degree or higher
And in Iowa those over 25 years old:
- 8.2% had less than high school graduation
- 31.5% had high school or equivalent
- 32.6% had some college or an Associates degree
- 27.7% had a Bachelor’s degree or higher
School Quality
Public School enrollment, graduation rates and pupil-to-teacher ratio are all published by the National Center for Education Statistics (2019).

The schools in Keokuk County with data from NCES are:
Keota Elementary School
- Total Enrollment: 219
- Percent eligible for free or reduced-price lunches: 31.0%
- Pupil-to-teacher ratio: 15.08
Keota High School
- Total Enrollment: 124
- Percent eligible for free or reduced-price lunches: 25.0%
- Pupil-to-teacher ratio: 9.16
Sigourney Elementary
- Total Enrollment: 302 students
- Percentage eligible for free or reduced-price lunches: 33.4%
- Pupil-to-teacher ratio: 13.77
Sigourney Jr-Sr High Sch
- Total Enrollment: 266
- Percent eligible for free or reduced-price lunches: 29.7%
- Pupil-to-teacher ratio: 13.42
Tri-County Elementary School
- Total Enrollment: 162
- Percent eligible for free or reduced-price lunches: 56.8%
- Pupil-to-teacher ratio: 16.96
Tri-County High School
- Total Enrollment:75
- Percent eligible for free or reduced-price lunches: 44.0%
- Pupil-to-teacher ratio: 8.55
Tri-County Junior High School
- Total Enrollment: 33
- Percent eligible for free or reduced-price lunches: 48.5%
- Pupil-to-teacher ratio: 8.82
Dropout rates and per pupil spending may also be located on localschooldirectory.com, but it is unclear the source of this data so it has not been included above.
Natural Capital
The physical environment including lakes and forests.
Land Quality
Land quality can be assessed using the Land Capability Classification and and Prime Farmland Classification from the Natural Resources Conservation Service (NRCS). This has
Farm and Cropland Value
According to the United States Department of Agriculture (USDA), National Agricultural Statistics Service (NASS; USDA, 2019) August 2019 Land Values assessment, the current value of an acre of farmland across the United States is $4,100 per acre.
In Iowa, farm real estate is worth $7,190 per acre. The range is $6,100 in Illinois to $7,280 in Indiana – the mean is $6,140.
In Iowa, cropland is $7,260 per acre. The range is $3,490 in Missouri, to $7,300 in Indiana. The mean is $6,170.
In Iowa, pasture per acre is $2,720. The range is $1,980 in Missouri, to $3,350 in Ohio. The mean is $2,667.
Air Quality
The Environmental Protection Agency (EPA; 2019) maintains the Air Quality Index (AQI). They provide downloadable files allowing you to see the data quality by county, by day. The most recent data from 2018 indicates that Muscantine County (the closest county to Keokuk County where AQI data is available) had 249 days (%68.2) ranked “Good” on the AQI, 116 (31.8%) days ranked “Moderate”, and 0 days ranked “Unhealthy for Sensitive Groups.”
This compares to Iowa as a whole, which from all Counties on all days throughout the year, had 3417 entries or %74.0 ranked Good, 1179 entries or %25.6 ranked Moderate, and 17 or %0.4 ranked “Unhealthy for Sensitive Groups.”
Water Quality
Water Quality can be assessed using the United States Geological Survey (USGS; 2008) data. The most recent data for Sigourney was collected from North Skunk River in 2008. Given the date of this data it is likely not a good resource for the current water quality in Sigourney.
The Clean Water Act requires states to report the percentage of surface water that is impaired or otherwise to be used for things like supporting aquatic life, drinking water or swimming.
According to the Goodguide Scorecard (n.d.), 6% or 9 sites in Keokuk County’s 4 watersheds report impairment. It’s not immediately obvious the date of that data collection. A watershed is a land area “that channels rainfall and snowmelt to creeks, streams, and rivers, and eventually to outflow points such as reservoirs, bays, and the ocean.” (National Oceanic and Atmospheric Administration, 2018)
Because GoodGuide only allows you to compare ZIP codes and counties so it’s not obvious how that compares to other parts of the State or the State as a whole.
Toxic Chemicals
There are currently no Superfund sites in Iowa. (EPA, 2018)
The Goodguide Scorecard (n.d.), which data for Keokuk County. This data indicates that 6% or 270 households in Keokuk County are at high risk of exposure to lead, putting Keokuk in the 80th percentile. This means that 80% of counties in Iowa had lower rates of houses at high risk of lead exposure.
Mineral Resource Availability
The National Minerals Information Center of the USGS (2015) provides information on the mineral availability in Iowa:
Iowa produces common clays, construction sand and gravel, crushed stone, dimension stone (limestone and “dolostone”), gemstones, gypsum, lime. peat, and portland cement. It is known for geodes and barite crystals exposed in sedimentary rocks.
They provide the value of all non-fuel minerals found in Iowa.
Political Capital
The connections between individuals and organizations with political forces, locally and regionally, in order to influence activities in their community.
Voter Turnout
According to FairVote (2019), Iowa as a whole had voter turnout of 69.1%, ranking 6th in the nation. According to the Iowa Secretary of State (n.d.) the total voter turnout was 72.77% and Keokuk County specifically had 71.19%. I am not sure the reason for this discrepancy but it illustrates that Keokuk’s voting participation is close to that of the State.
Voting participation, % of eligible voters who registered and voted in federal elections
Social Capital
The connections between the individuals and organizations in the town.
Number of Membership Associations
The County Health Rankings allow one to see the number of membership associations per 10,000 population. In Iowa in 2016 the average was 15.1 membership organizations per 10,000 residents. In Keokuk County specifically, the number was 16.8. (County Health Rankings, 2019)
Other Measures
Other measures that were suggested but not included for reasons of accessibility or difficulty in interpreting them were:
- Percentage of the population with specific diseases
- Deaths due to mental disorders or suicide
- Reproductive health indicators
- Rates of violent crime by type
- Number of patents
- Share of households responding to the census by mail
- Share of survey respondents agreeing that “most people are honest”
- Seniority of Congressional representatives, Almanac of American Politics
- Leadership positions of Congressional representatives
- Competitiveness of voting
Conclusion
If you don’t start with a good baseline, it’s hard to know how to improve. Hopefully this has given you some ideas for metrics that you’ll be able to collect for your own community in order to begin building an economic development plan.
The things that stick out to me from this data:
- Keokuk County needs to diversify away from mining and natural resource exploitation
- Keokuk County needs to add opportunities for higher education. Perhaps a virtual college campus where students can study close to home
- Keokuk County has a median income slightly lower than the general population and an unemployment rate that is higher – pursuing remote work may be a way to alleviate this (which would go well with the above point, if a remote work/study space were created)
- Iowa sits on very valuable farmland and farming should continue to be a strong asset to the county and the state
- Increasing immigration and attracting immigrants will help inject much-needed capital into Keokuk County, along with highly skilled workers who are more likely to pursue entrepreneurship
Let me know your thoughts.
References
County Health Rankings. (2019). “Social associations in Iowa. | County Health Rankings & Roadmaps” Retrieved on September 5, 2019 from https://www.countyhealthrankings.org/app/iowa/2019/measure/factors/140/data
Environmental Protection Agency (EPA). (2018). “Search for Superfund Sites Where You Live | Superfund | EPA” Retrieved on September 4, 2019 from https://www.epa.gov/superfund/search-superfund-sites-where-you-live
Environmental Protection Agency (EPA). (2019). “Download Files | Air Data | US EPA” Retrieved on September 4, 2019 from https://aqs.epa.gov/aqsweb/airdata/daily_aqi_by_county_2018.zip (ZIP file, CSV)
FairVote. (2019) “Voter Turnout – FairVote” Retrieved on September 5, 2019 from https://www.fairvote.org/voter_turnout#voter_turnout_101
Goodguide Scorecard. (n.d.) “About Your Community” Retrieved on September 4, 2019 from http://scorecard.goodguide.com/community/index.tcl?zip_code=52591&set_community_zipcode_cookie_p=t&x=0&y=0
Iowa Department of Public Health. (2016) 2016 Vital Statistics of Iowa. Retrieved on September 5, 2019 from https://idph.iowa.gov/Portals/1/userfiles/68/HealthStats/vital_stats_2016-20171211.pdf
Iowa Secretary of State. (n.d.) 2016 General Election Turnout Report. Retrieved on September 5, 2019 from https://sos.iowa.gov/elections/pdf/2016/general/turnout.pdf
Iowa State University. (2019) Retail Trade Analysis Report Fiscal Year 2018. Retrieved on September 5, 2019 from https://www.icip.iastate.edu/sites/default/files/retail/retail_19107.pdf
Iowa Workforce Development. (2016). Sigourney, Iowa Laborshed Analysis: A Study in Workforce Characteristics. Retrieved on September 5, 2019 from https://www.iowaworkforcedevelopment.gov/sites/search.iowaworkforcedevelopment.gov/files/documents/sigourney_execsummary2016.pdf
Iowa Workforce Development. Current Employment Statistics. Retrieved on September 5, 2019 from https://www.iowaworkforcedevelopment.gov/current-employment-statistics
National Center for Education Statistics (NCES). (2019) “Search for Public Schools – Sigourney Elementary (19268001494)” Retrieved on September 5, 2019 from https://nces.ed.gov/ccd/schoolsearch/school_detail.asp?Search=1&SchoolID=192628001494&ID=192628001494
National Oceanic and Atmospheric Administration (NOAA). (2018) “What is a Watershed?” Retrieved on September 4, 2019 from https://oceanservice.noaa.gov/facts/watershed.html
Pender, J., Marré, A. & Reeder, R. (2012) Rural Wealth Creation: Concepts, Strategies, and Measures. Economic Research Report Number 131. Economic Research Service, United States Department of Agriculture (USDA).
U.S. Census Bureau (2018) “U.S. Census Bureau QuickFacts: Keokuk County, Iowa” Retrieved on September 5, 2019 from https://www.census.gov/quickfacts/fact/table/keokukcountyiowa/IPE120217
U.S. Census Bureau. (2012) Americans with Disabilities: 2010. Household Economic Studies. Retrived on September 5, 2019 from https://www2.census.gov/library/publications/2012/demo/p70-131.pdf
U.S. Census Bureau. (2017a). 2013-2017 American Community Survey 5-Year Estimates. Retrieved on September 4, 2019 from https://factfinder.census.gov/bkmk/table/1.0/en/ACS/17_5YR/B25047/1600000US1973110
U.S. Census Bureau. (2017b). 2013-2017 American Community Survey 5-Year Estimates. Retrieved on September 4, 2019 from https://factfinder.census.gov/bkmk/table/1.0/en/ACS/17_5YR/B25047/0500000US19107
U.S. Census Bureau. (2017c). 2013-2017 American Community Survey 5-Year Estimates. Retrieved on September 5, 2019 from https://factfinder.census.gov/faces/tableservices/jsf/pages/productview.xhtml?pid=ACS_17_5YR_S1501&prodType=table
United States Department of Agriculture. (2019) Land Values 2019 Summary: August 2019. National Agricultural Statistics Service (NASS). Retrieved on September 4, 2019 from https://downloads.usda.library.cornell.edu/usda-esmis/files/pn89d6567/g732dn07g/9306t9701/land0819.pdf
United States Geological Survey (USGS). (2008) National Water Information System. Water Quality Samples for the Nation USGS 05472500 North Skunk River near Sigourney IA. Retrieved on September 4, 2019 from https://nwis.waterdata.usgs.gov/usa/nwis/qwdata/?site_no=05472500&agency_cd=USGS&format=inventory&inventory_output=0&rdb_inventory_output=file&TZoutput=0&pm_cd_compare=Greater%20than&radio_parm_cds=all_parm_cds&qw_attributes=0&qw_sample_wide=wide&rdb_qw_attributes=0&date_format=YYYY-MM-DD&rdb_compression=file&submitted_form=brief_list
United States Geological Survey (USGS). (2015) National Minerals Information Center. 2015 Materials Yearbook. Retrieved on September 4, 2019 from https://prd-wret.s3-us-west-2.amazonaws.com/assets/palladium/production/atoms/files/myb1-2015-stati.pdf